
| | 1 | initial version |
Hi Kyle,
Visualizations in GenomeBrowse are limited to what is available within the annotation sources or data files that are currently loaded into the window, we do not perform any type of computations on the data. With variant sources there are a few annotation sources that will provide c. notation for the variant.
The most comprehensive source is the ExAC VEP Annotations 0.3, BROAD source that is available from the Public Annotations repository (File > Add). If you load this source any variant in your data that is also in the ExAC track will contain this information.
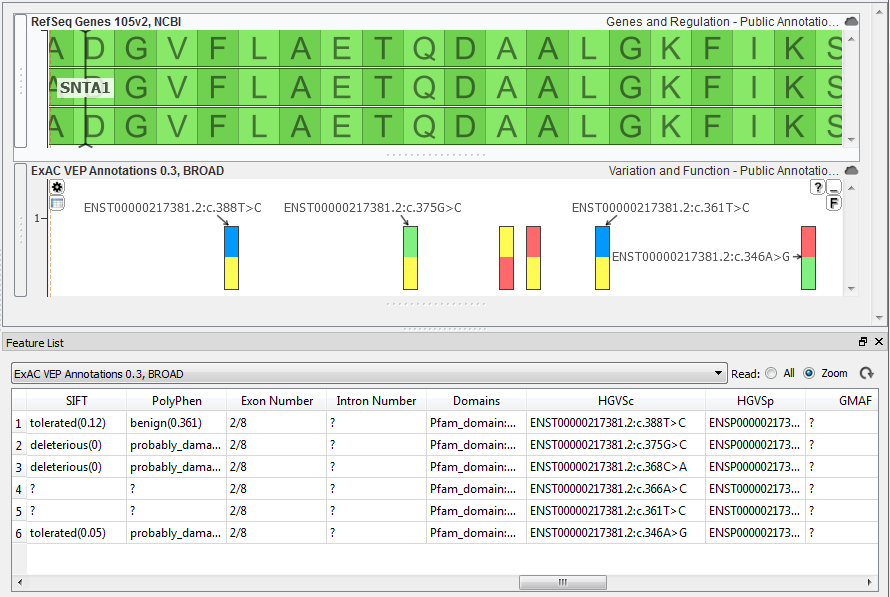
To make the HGVS c. notation the label on the plot just hover your mouse over the ExAC plot and you should see a gear icon appear in the upper left corner, just click the icon to change the labels.
Let me know if you have further questions.
Thanks, Jami...